

By Michael Jensen, MD
Division of Endocrinology and Metabolism, Department of Internal Medicine, Mayo Clinic and Foundation, Rochester, MN, USA
jensen@mayo.edu

Background
Key Points
- There is a big difference between "metabolically obese, normal weight" as proposed by Ruderman et al. [2, 3] and "normal weight obesity". The former defines a group that may benefit from changes in eating (and activity) habits whereas the latter is an epidemiological construct with little physiological basis and limited clinical utility.
- Individuals with low amount of body fat may sometimes benefit from treatments traditionally provided to obese patients, and some patients who meet body mass index criteria for obesity will not see health benefits from weight loss.
- Clinicians should distinguish between the two and apply treatments as indicated by health, not by body mass index or percent body fat criteria.
A recent publication on the topic of normal weight obesity [1] has received media attention. The investigators used the National Health and Nutrition Examination Survey database, containing information on body mass index (BMI), percent body fat and metabolic problems related to obesity from over 13,000 adults age 20-80. Using the traditional BMI cutoff values of ≤25 kg/m2 for normal weight, 25-29.9 kg/m2 for overweight and >30 kg/m2 for obesity, they assessed the prevalence of "obesity" in each category. The World Health Organization (WHO)-recommended definition for obesity is 25% body fat in men and 35% body fat in women. The authors concluded that the current BMI criteria miss over half the people who would be categorized as "obese" using WHO criteria, especially in older adults.
I was surprised about the buzz surrounding "normal weight obesity". Many endocrinologists may have been asking "Where's the beef?" because almost 30 years ago an endocrinologist, Dr. Neil Ruderman, coined the term "metabolically obese normal weight" [2] to describe non-obese men and women with hypertriglyceridemia, type 2 diabetes or hypertension. He speculated on a number of possible explanations for this phenomenon [2], many of which have been confirmed in the following years. More recently, Dr. Ruderman and colleagues have published an update on this topic [3] providing more in-depth speculation regarding the potential mechanisms and explanations for the phenomenon of the normal weight, metabolically obese adult.
Adipose Tissue Functions

The WHO definition of obesity is based only upon percent body fat, which forces us to consider the role(s) of body fat and whether the amount that is unhealthy can be so specifically defined. Adipose tissue performs a surprising number of functions (Table 1), and although Americans tend to want to have as little body fat as possible, this is not always ideal for health. Most obviously, adipose tissue serves as a reservoir for energy. Adipose tissue is the primary means for storing circulating triglycerides during times of "feast" and making those triglycerides available to other tissues in the form of free fatty acids (FFA) at times of famine (Figure 1). Because the triglyceride fatty acids are stored in a relatively anhydrous fashion (as opposed to glucose and protein), relatively small amounts of adipose tissue store large amounts of energy. One kg of adipose stores ~7000 kcal, enough to provide the complete energy needs of an average woman for 3 days. Thus, a normal weight 60 kg woman with 30% body fat (18 kg) has the equivalent of 2 months of energy stored in adipose tissue! This is akin to carrying around 2 months' worth of groceries in a normal, healthy amount of body fat.
 [Click to enlarge]
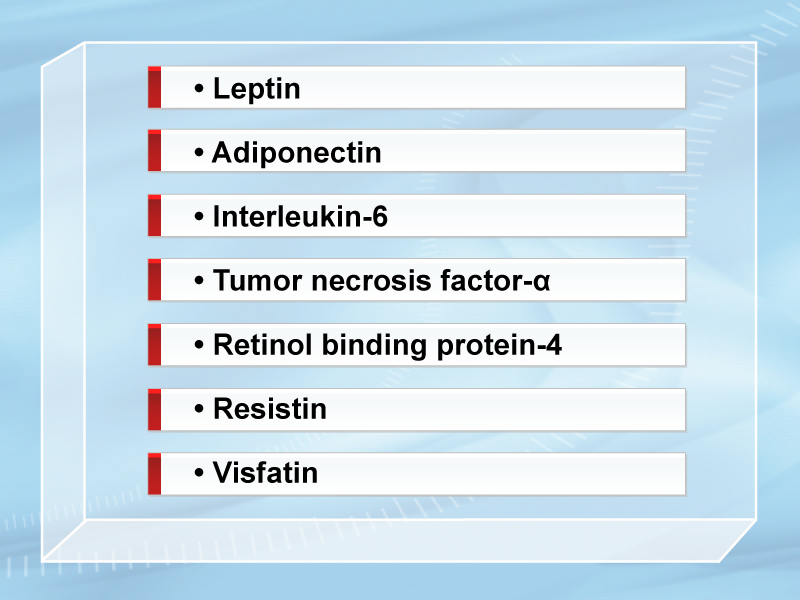
Endocrinologists would likely argue that the endocrine functions of adipose tissue are of second-most importance-leptin and adiponectin being perhaps the two most well-known hormones produced almost solely by adipose tissue. Adipose tissue also produces a number of other cytokines/peptides (Table 2), but it is difficult to know the relative contributions of adipose vs. non-adipose tissue to the circulating concentrations of these molecules. Another important function of adipose tissue is immune protection. Not only do preadipocytes and immune cells (macrophages) share a common lineage [4], the high local fatty acid concentrations in adipose tissue are highly toxic to bacteria and fungi, providing an excellent defence. It is speculated that subcutaneous fat plays a key role in protecting us from infections following skin wounds or superficial infections. Likewise, intra-abdominal (visceral) fat has long been recognized as a barrier, albeit imperfect, to peritoneal catastrophes such as a perforated viscus. The other functions, such as mechanical protection (think falls or sitting on a hard surface), insulation and cosmetic, are seldom considered until one encounters extremely wasted patients with almost no body fat.
Use of BMI in Clinical Practice-Comparison with Body Fat Measures
The use of the term "normal weight obesity" also raises the question of how BMI was created for use in epidemiological studies and clinical practice and whether it was ever intended to predict percent body fat. BMI requires only the measurement of height and weight in the clinic and leads to reasonable characterization as to whether individuals are at lower or higher risk for weight-related complications [5]. Despite the availability of very sophisticated imaging techniques to measure percent fat, regional fat distribution, lean tissue, etc., it turns out that BMI, when combined with a simple measure of fat distribution such as waist circumference, provides as good or better predictive value for metabolic abnormalities than does percent body fat [6]. BMI has been compared with percent body fat as a way to define risk for metabolic abnormalities, and in general, BMI performs as well as percent fat [7]. Unfortunately, neither BMI nor percent body fat are exceptionally good predictors of the metabolic consequences of obesity for most adults in the BMI categories below ~ 30 kg/m2 [8]. Thus, while BMI and percent body fat are correlated [7] and are both somewhat predictive of obesity-related health consequences, neither is perfect.
Definitions of Obesity
 [Click to enlarge]
 [Click to enlarge]
This brings us to the issue of finding an acceptable, medically useful definition of obesity. My contention is that obesity cannot reasonably be defined by some fixed percent body fat no matter how well measured. I propose the following two-part medical definition for obesity: 1) sufficient body fat to result in a dysmetabolic response and/or mechanical complications; AND 2) a long-term reduction in body fat leads to long-term improvements in health. Note that this definition may include normal weight individuals with hypertension, dyslipidemia, etc., provided that reductions in body fat alone (not increased exercise, which may have effects independent of body fat) improve or resolve the problem. By this definition, a woman with a BMI of 32 kg/m2 with no metabolic (Table 3) or mechanical abnormalities related to obesity (Table 4) would not be considered obese. Because many of the metabolic abnormalities in obesity are linked to abnormal lipid fuel metabolism by adipose tissue, the normal regulation will be reviewed briefly.
Regulation of Adipose Tissue
Fuel Storage/Release
Adipose fatty acid storage
Adipocytes take up circulating fat via two pathways. The major and most well understood pathway of fatty acid uptake is dependent upon lipoprotein lipase (LPL), and the other, less well appreciated mechanism is direct uptake and storage of circulating FFA. LPL is responsible for the hydrolysis of meal-derived triglycerides in chylomicrons and VLDL triglyceride at the capillary endothelium. Given that dietary fat intake, and thus chylomicron triglyceride delivery to the circulation, is commonly ≤100 g/day and VLDL triglyceride (largely derived from circulating FFA) secretion is ~15-25 g/day, it is easy to understand why variations in LPL activity would be seen as an important issue for fatty acid storage.
 [Click to enlarge]
In normal weight men and women, the storage of dietary fatty acids in upper and lower body subcutaneous fat is strongly correlated with postprandial, but not postabsorptive, adipose tissue LPL activity [9]. For unknown reasons, a similar relationship between adipose tissue LPL activity and meal fatty acid storage does not seem to hold true for overweight and obese women [10]. The implications of storage for obesity-related issues revolve around the limited clearance of triglycerides from the circulation. Low LPL activity will limit VLDL triglyceride clearance, and thus for any given degree of VLDL triglyceride production, plasma concentrations will be higher. In addition, triglyceride clearance is saturable, meaning that once a certain plasma concentration of triglycerides has been reached, all available LPL activity is being used. Any further inflow of triglycerides, including from chylomicrons, will have drastic effects on increasing plasma triglyceride concentrations.
 [Click to enlarge]
Subcutaneous adipocytes also directly take up and store circulating FFA independent of the VLDL triglyceride pathway, accounting for a relatively small storage pathway after an overnight fast (~3% and ~9% in normal weight men and women, respectively) [11].
Adipose fatty acid release
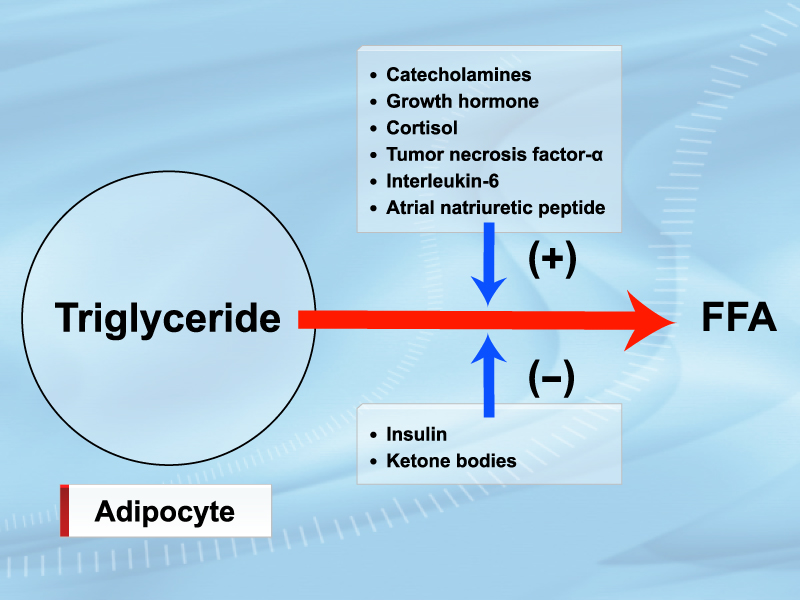
The regulation of adipocyte FFA release has been very well studied and the modulators of lipolysis reasonably well defined (Figure 2). The factors that have been shown to have an important role in regulating FFA release in vivo in humans have been relatively well studied [12-17] (Table 5).
Of particular interest, obese individuals with an upper body/intra-abdominal fat distribution have elevated FFA concentrations due to increased lipolysis under both postabsorptive and postprandial conditions [18, 19], whereas equally obese persons with a lower body fat distribution have normal FFA concentrations/metabolism. This likely contributes to the host of metabolic complications associated with abdominal obesity, which is now well-recognized as a very important predictor of adverse health consequences.
Etiology of Metabolic Complications of Obesity
There are a large number of metabolic complications that can be attributed to excess body fat (Table 3), as well as a number of mechanical complications directly linked to excess body fat (Table 4). While it is relatively easy to understand how mechanical complications can occur from excess body fat, understanding the etiology of metabolic complications of obesity is rather more complex. In order to understand how body fat might result in metabolic abnormalities, it is important to consider regulation of adipose tissue function with regards to fuel storage.
The effect of FFA on glucose metabolism in humans has been studied extensively; it is well established that obesity and increased plasma FFA concentrations are risk factors for the development of type 2 diabetes [20, 21]. The ability to manipulate FFA concentrations has shown that the FFA/metabolic function associations are not merely related abnormalities, but cause and effect. Studies using acipimox, an inhibitor of lipolysis, to lower FFA or lipid emulsion infusions to raise FFA have helped define the contribution of FFA to insulin action with respect to glucose, lipoprotein and vascular regulation. Elevated plasma FFA upregulate glucose production and impair muscle glucose uptake, oxidation and storage [22, 23], perhaps through generation of excess intracellular ceramides, diacylglycerol or other lipid signalling molecules. FFA also affect insulin secretion [21] as intracellular metabolites of fatty acids, such as long-chain acyl CoA and diacylglycerol, trigger insulin release [24, 25] as well as cell dysfunction [26]. The perturbations in glucose metabolism and insulin secretion that reflect increased systemic FFA are implicated in the etiology of type 2 diabetes.
In addition to their effects on glucose metabolism and diabetes risk, elevated FFA concentrations have been shown to be risk markers for ischemic heart disease [27], perhaps indirectly through playing a part in the development of hypertension [28, 29] or directly via induction of vascular endothelial injury [30].
Examples of Body Fat/Health Outcome Exceptions
Patients with lipodystrophy are unable to store fatty acids as triglycerides in adipocytes, yet have extreme hunger due to low leptin (leptin is produced by adipocytes in increasing amounts with increasing fat). Thus, when lipodystrophic patients consume fat but cannot oxidize all of it, the triglyceride is stored in liver, muscle and other ectopic depots. Because there is no adipose tissue to store chy-lomicron triglycerides, severe postprandial hypertriglyceridemia is common. These patients develop non-alcoholic fatty liver disease/non-alcoholic steatohepatitis (NAFLD/NASH), diabetes and extreme hyperlipidemia despite negligible body fat. Fortunately, leptin replacement, which reduces hunger and lowers food intake by ~40%, also greatly improves the metabolic profile of these patients [31]. Similar beneficial effects have been seen with extreme exercise, which allows oxidation of dietary fat rather than storage in ectopic sites.
Many of our patients are now older and have BMIs that would be considered "higher risk" in the young and middle-aged. An enormous body of evidence indicates that the lowest mortality rates in the elderly (variably defined as >60 to >70 years) is at BMIs of 27-29 kg/m2, with little appreciable increase at BMIs 30-35 kg/m2 [32]. These patients are also likely to be the ones who are "over-fat" as characterized by body composition measures [1]. The paradox of lower mortality with greater body fat may relate to the ability to survive acute illnesses better thanks to greater reserves or some other factors relating to immune function. Thus, it would be a mistake to universally recommend weight loss for the elderly with BMIs above the normal weight range without taking into account whether there are urgent medical reasons to do so.
References
- Romero-Corral A, Somers VK, Sierra-Johnson J, et al. Accuracy of body mass index in diagnosing obesity in the adult general population. Int J Obes (Lond) 2008; 32: 959-66.
- Ruderman NB, Schneider SH and Berchtold P. The "metabolically-obese," normal-weight individual. Am J Clin Nutr 1981; 34: 1617-21.
- Ruderman N, Chisholm D, Pi-Sunyer X, et al. The metabolically obese, normal-weight individual revisited. Diabetes 1998; 47: 699-713.
- Charriere G, Cousin B, Arnaud E, et al. Preadipocyte conversion to macrophage. Evidence of plasticity. J Biol Chem 2003; 278: 9850-5.
- Bray GA. Overweight is risking fate. Definition, classification, prevalence, and risks. Ann N Y Acad Sci 1987; 499: 14-28.
- Vega GL, Adams-Huet B, Peshock R, et al. Influence of body fat content and distribution on variation in metabolic risk. J Clin Endocrinol Metab 2006; 91: 4459-66.
- Zhu S, Wang Z, Shen W, et al. Percentage body fat ranges associated with metabolic syndrome risk: results based on the third National Health and Nutrition Examination Survey (1988-1994). Am J Clin Nutr 2003; 78: 228-35.
- Brooks Y, Black DR, Coster DC, et al. Body mass index and percentage body fat as health indicators for young adults. Am J Health Behav 2007; 31: 687-700.
- Votruba SB and Jensen MD. Sex-specific differences in leg fat uptake are revealed with a high-fat meal. Am J Physiol Endocrinol Metab 2006; 291: E1115-23.
- Votruba SB, Mattison RS, Dumesic DA, et al. Meal fatty acid uptake in visceral fat in women. Diabetes 2007; 56: 2589-97.
- Shadid S, Koutsari C and Jensen MD. Direct free fatty acid uptake into human adipocytes in vivo: relation to body fat distribution. Diabetes 2007; 56: 1369-75.
- Birkenfeld AL, Boschmann M, Moro C, et al. Lipid mobilization with physiological atrial natriuretic peptide concentrations in humans. J Clin Endocrinol Metab 2005; 90: 3622-8.
- Cersosimo E, Danou F, Persson M, et al. Effects of pulsatile delivery of basal growth hormone on lipolysis in humans. Am J Physiol 1996; 271: E123-6.
- Divertie GD, Jensen MD, Cryer PE, et al. Lipolytic responsiveness to epinephrine in nondiabetic and diabetic humans. Am J Physiol 1997; 272: E1130-5.
- Divertie GD, Jensen MD and Miles JM. Stimulation of lipolysis in humans by physiological hypercortisolemia. Diabetes 1991; 40: 1228-32.
- Jensen MD, Caruso M, Heiling V, et al. Insulin regulation of lipolysis in nondiabetic and IDDM subjects. Diabetes 1989; 38: 1595-601.
- Meek SE, Nair KS and Jensen MD. Insulin regulation of regional free fatty acid metabolism. Diabetes 1999; 48: 10-4.
- Jensen MD, Haymond MW, Rizza RA, et al. Influence of body fat distribution on free fatty acid metabolism in obesity. J Clin Invest 1989; 83: 1168-73.
- Roust LR and Jensen MD. Postprandial free fatty acid kinetics are abnormal in upper body obesity. Diabetes 1993; 42: 1567-73.
- Mokdad AH, Ford ES, Bowman BA, et al. Prevalence of obesity, diabetes, and obesity-related health risk factors, 2001. JAMA 2003; 289: 76-9.
- Paolisso G, Tataranni PA, Foley JE, et al. A high concentration of fasting plasma non-esterified fatty acids is a risk factor for the development of NIDDM. Diabetologia 1995; 38: 1213-7.
- Kelley DE, Mokan M, Simoneau JA, et al. Interaction between glucose and free fatty acid metabolism in human skeletal muscle. J Clin Invest 1993; 92: 91-8.
- Randle PJ, Priestman DA, Mistry SC, et al. Glucose fatty acid interactions and the regulation of glucose disposal. J Cell Biochem 1994; 55 Suppl: 1-11.
- Prentki M. New insights into pancreatic beta-cell metabolic signaling in insulin secretion. Eur J Endocrinol 1996; 134: 272-86.
- Prentki M, Joly E, El-Assaad W, et al. Malonyl-CoA signaling, lipid partitioning, and glucolipotoxicity: role in beta-cell adaptation and failure in the etiology of diabetes. Diabetes 2002; 51 Suppl 3: S405-13.
- Prentki M and Nolan CJ. Islet beta cell failure in type 2 diabetes. J Clin Invest 2006; 116: 1802-12.
- Pirro M, Mauriège P, Tchernof A, et al. Plasma free fatty acid levels and the risk of ischemic heart disease in men: prospective results from the Quebec Cardiovascular Study. Atherosclerosis 2002; 160: 377-84.
- Steinberg HO, Tarshoby M, Monestel R, et al. Elevated circulating free fatty acid levels impair endothelium-dependent vasodilation. J Clin Invest 1997; 100: 1230-9.
- Stojiljkovic MP, Zhang D, Lopes HF, et al. Hemodynamic effects of lipids in humans. Am J Physiol Regul Integr Comp Physiol 2001; 280: R1674-9.
- Piro S, Spampinato D, Spadaro L, et al. Direct apoptotic effects of free fatty acids on human endothelial cells. Nutr Metab Cardiovasc Dis 2008; 18: 96-104.
- Oral EA, Simha V, Ruiz E, et al. Leptin-replacement therapy for lipodystrophy. N Engl J Med 2002; 346: 570-8.
- Grabowski DC and Ellis JE. High body mass index does not predict mortality in older people: analysis of the Longitudinal Study of Aging. J Am Geriatr Soc 2001; 49: 968-79.
